Markets Confusing? Ask Edgen Search.
Instant answers, zero BS, and trading decisions your future self will thank you for.
Try Search Now
RKT vs. UWMC: The Flywheel vs. The Pipeline, Rocket Takes the Long Game
EDGEN RESEARCH · COMPETITOR ANALYSIS
RKT vs. UWMC: The Flywheel vs. The Pipeline, Rocket Takes the Long Game
RKT: BUY | PT $22.00 | +51% Upside · UWMC: HOLD | PT $6.00 | +24% Upside
COVER RATINGS
| RKT | UWMC |
|---|---|---|
Rating | BUY | HOLD |
Price Target | $22.00 | $6.00 |
Current Price | $14.54 | $4.84 |
Upside | +51% | +24% |
Market Cap | $41.1B | $7.8B |
Exchange | NYSE | NYSE |
Investment Summary
Rocket Companies and UWM Holdings are the two undisputed titans of the U.S. mortgage origination market — but they are running fundamentally different races. RKT has spent the last 18 months making $16 billion in acquisitions (Redfin + Mr. Cooper) to construct a vertically integrated homeownership ecosystem designed to be resilient across rate cycles. UWMC has stayed laser-focused on dominating the independent broker channel with aggressive pricing, proprietary AI tools, and its controversial "All-In" lock-in strategy.
RKT is the better long-term bet. Its Q4 2025 earnings inflection — $2.4B in adjusted revenue (+105.6% YoY), a 3.20% GOS margin, and a $68M GAAP net profit — confirmed that the Flywheel thesis is working. The company now controls a $2.1 trillion servicing portfolio with 9.5 million captive clients, generates roughly $5B in annualized recurring servicing fee income, and is building a structural cost-per-acquisition advantage that traditional originators cannot replicate.
UWMC is a rate cut call, not a business transformation. It is the volume machine — originating a record $41.7B in Q3 2025 and holding 43.5% of the wholesale channel — but its 1.30% GOS margin (versus RKT's 3.20%) leaves little room for pricing shocks, legal setbacks from its "All-In" policy, or a delayed monetary policy pivot.
RKT — Bull Case
● $2.1 trillion servicing portfolio generates ~$5B in annualized recurring fees — structurally lower CAC for future originations
● Redfin's 62M monthly active users is a top-of-funnel engine: purchase volume jumped 40% QoQ after integration
● Adj. EBITDA margin expanded to 24% in Q4 2025; management guides $400M+ in annual synergies from Mr. Cooper
● 2026 consensus EPS of $0.84 (+200% YoY) and 2027E of $1.16 still appear conservative given synergy track record
● AI-driven Rocket Logic platform handles 2× the loan volume with half the pre-2022 headcount — structural CPLO reduction underway
RKT — Bear Case
● High macroeconomic sensitivity: 30-year rates stuck at 6.1% suppresses refinancing, the largest lever in servicing recapture
● Integration complexity: absorbing Redfin and Mr. Cooper simultaneously in a single fiscal year creates execution risk
● FHFA's 20% servicing market share cap limits future M&A optionality
● Stock remains technically weak: trading below all key moving averages; $13.18 is the next hard support
UWMC — Bull Case
● 43.5% wholesale market share + "All-In" network lock-in creates durable volume dominance
● Mia AI assistant drove 14,000+ closed loans in Q3 alone — measurable tech ROI
● Two Harbors deal doubles MSR portfolio to ~$400B, adding $150M in projected annual synergies
● 2026E EPS of $0.47 implies 262% YoY growth — extreme leverage to any rate normalization
● $0.10/quarter dividend yields ~8.3% on the current price — a durable cash return floor
UWMC — Bear Case
● GOS Margin of 130 bps (vs. RKT 320 bps) leaves thin pricing headroom; a renewed price war could erase expansion
● "All-In" legal exposure: class-action suits and ongoing antitrust scrutiny create unquantified tail risk
● CEO Mat Ishbia has sold hundreds of millions in stock under a 10b5-1 plan — persistent insider selling headwind
● P/B of 54.83x prices in cyclical perfection; any execution miss re-rates aggressively lower
Sector Snapshot
The U.S. mortgage market is in a challenging but transitional phase. The 30-year fixed rate has settled near 6.1% as of March 2026 — down from peak levels but still well above the sub-4% rates that defined 2020–2021. Total origination volume in 2025 reached approximately $2.0 trillion. The industry is undergoing accelerating consolidation, with the top 10 players now capturing 34% of volume (vs. 24% in 2023). Mortgage tech is a critical battleground, with a 25% CAGR projected through 2032.
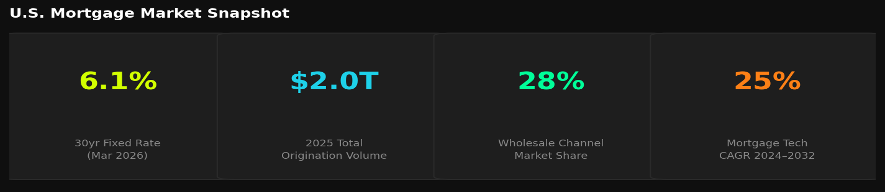
Fig 1 — U.S. Mortgage Market Snapshot
The Business Models: Ecosystem vs. Pipeline
RKT and UWMC are operating two entirely different competitive strategies. RKT is building a multi-sided homeownership platform — capturing the consumer at top-of-funnel (Redfin search), guiding them through financing (Rocket Mortgage), closing (Amrock), and retaining them for life through servicing (Mr. Cooper). UWMC operates exclusively through independent mortgage brokers, offering elite technology and pricing to win broker loyalty rather than consumer mindshare. The head-to-head metrics reveal the stark divergence.

Fig 2 — RKT vs. UWMC Core Metrics Head-to-Head
Financial Performance
RKT — Accelerating Into Scale
Rocket's revenue trajectory has undergone a step-change following its acquisitions. Full-year 2025 adjusted revenue reached $6.9B. The Q4 2025 print of $2.4B was a 105.6% YoY surge, driven by a record $47.3B in closed loan origination volume — up 46% sequentially from Q3. The company swung to GAAP profitability ($68M net income in Q4) after a $124M loss the prior quarter. Adjusted EBITDA hit $592M at a 24% margin in Q4, up from 20% in Q3.
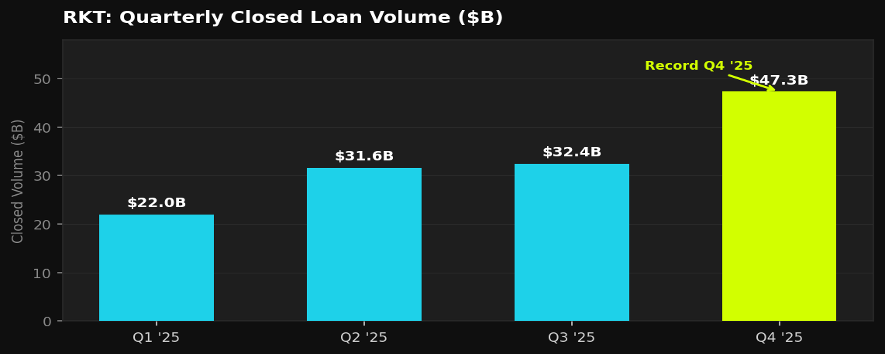
Fig 3 — RKT: Quarterly Closed Loan Volume ($B)
UWMC — Volume Records, Margin Recovery
UWMC's core operational metrics are exceptionally strong. The company posted record-high Q3 2025 origination volume of $41.7B — its highest level since 2021. Revenue of $843.3M grew 13.1% YoY. GOS margins expanded sequentially through all three reported quarters of 2025, from 94 bps in Q1 to 130 bps in Q3. Q4 guidance of $43–$50B in volume and 105–130 bps margins signals continued momentum. Key caveat: GAAP earnings remain distorted by non-cash MSR fair value swings.
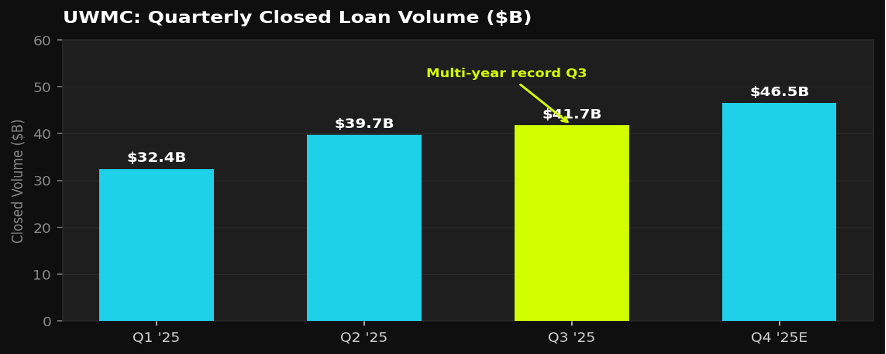
Fig 4 — UWMC: Quarterly Closed Loan Volume ($B)
Key Financial Metrics
Metric | RKT (FY2024) | RKT (FY2025) | UWMC (FY2024) | UWMC (Q3 2025 TTM) |
|---|---|---|---|---|
Revenue | ~$3.4B | $6.9B adj. | $2.16B | ~$3.0B |
GOS Margin | ~2.0% | 3.20% (Q4) | ~1.0% | 1.30% (Q3) |
Net Income | Loss | $68M (Q4) | $329.4M | Volatile (MSR adj.) |
Total Assets | ~$20B | $60.7B | ~$14B | ~$17B |
Liquidity | $9.3B | $10.1B | N/A | $3.0B |
D/E Ratio | ~2.0x | ~1.30x | N/A | 2.45x (non-funding) |
Employees | ~14,200 | ~23,500 | ~9,100 | ~9,100 |
The GOS Margin Gap — RKT's Most Durable Advantage
The gain-on-sale margin is the single most revealing metric in this comparison. RKT's 3.20% in Q4 2025 is more than 2.4× UWMC's 1.30% in Q3 2025. This gap reflects the structural difference in their business models: RKT's direct-to-consumer brand commands a pricing premium, while UWMC's wholesale model competes primarily on price efficiency. The trajectory matters too — both companies are expanding margins, but RKT is expanding from a significantly higher base.
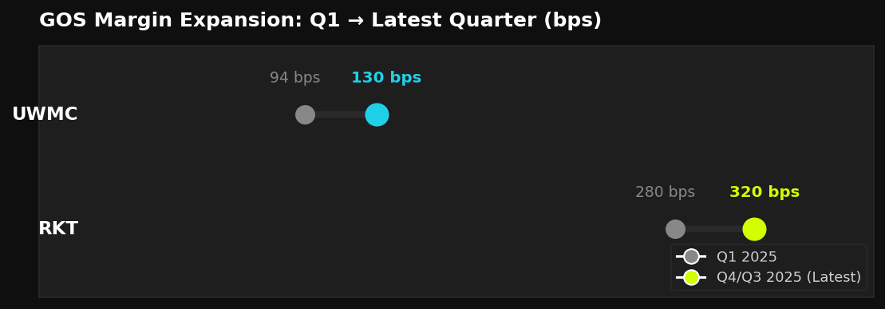
Fig 5 — GOS Margin Expansion: Q1 → Latest Quarter (bps)
Price Target Analysis
RKT — Deep Value at Current Levels
RKT's Q4 2025 earnings beat triggered a flurry of upward price target revisions. The consensus has strengthened to 8 Buy / 11 Hold / 0 Sell among 19 analysts. The stock's -39% decline from its $24.36 January 2026 peak has created a significant dislocation between analyst conviction and market price. Our $22.00 PT aligns with the consensus median and implies 51% upside.
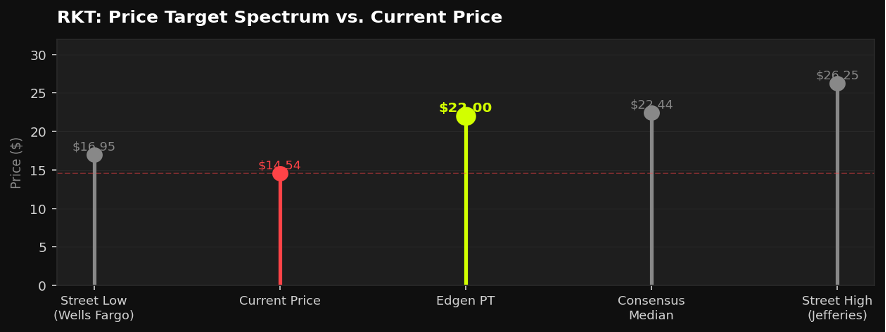
Fig 6 — RKT: Price Target Spectrum vs. Current Price
UWMC — Fairly Priced, Rate-Dependent
UWMC's analyst consensus reflects cautious optimism: approximately 4–7 Buy and 9 Hold ratings, with zero Sells. The median PT of $6.50 sits 34% above current prices, but the range from $5.05 to $10.50 underscores profound uncertainty about the rate cycle timing. Our $6.00 PT reflects current execution but stops short of pricing in a rate-driven volume surge that has not yet materialized.
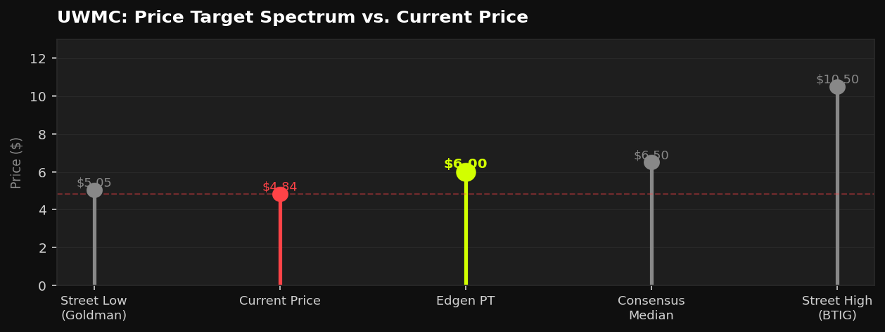
Fig 7 — UWMC: Price Target Spectrum vs. Current Price
Competitive Benchmark
Both companies are powerful within their chosen strategies, but across the six dimensions that define long-term competitive durability, RKT holds a decisive edge. UWMC scores highest on volume scale and rate sensitivity — the two factors that matter most in a rate-cut environment. RKT dominates on ecosystem breadth, consumer brand, balance sheet health, and GOS margin pricing power.
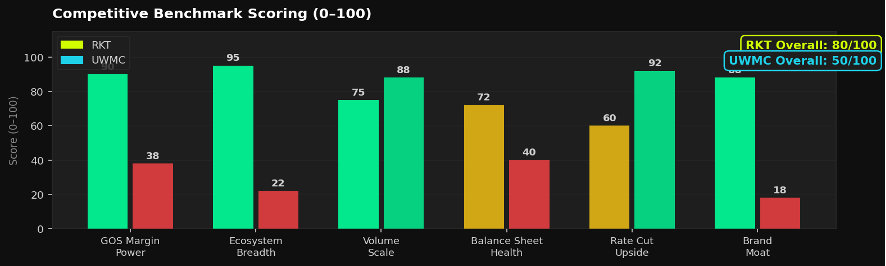
Fig 8 — Competitive Benchmark Scoring (0–100)
EPS Growth Trajectory
Analyst consensus projects explosive EPS growth for both companies in 2026, driven by cyclical recovery assumptions. RKT's growth story is compounded by its structural synergy narrative — $400M+ in guided Mr. Cooper cost synergies on top of an improving rate environment. UWMC's EPS growth is almost entirely macro-dependent: it represents pure operating leverage into a rate-cut cycle.
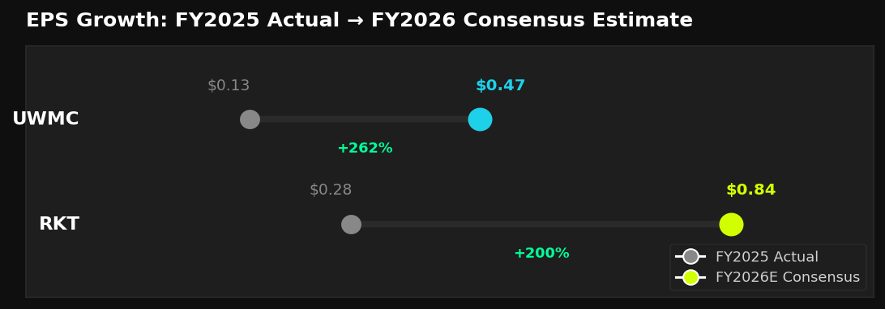
Fig 9 — EPS Growth: FY2025 Actual → FY2026 Consensus Estimate
Rate Cut Sensitivity
A sustained -100 bps decline in the 30-year fixed rate is the most powerful single macro catalyst for both names. UWMC has materially higher sensitivity given its pure-play origination focus and extreme operating leverage. However, RKT's massive $2.1T servicing portfolio means rate cuts also unlock a high-margin refinancing recapture engine — the "Rocket Flywheel" — which provides a second, higher-quality lever.
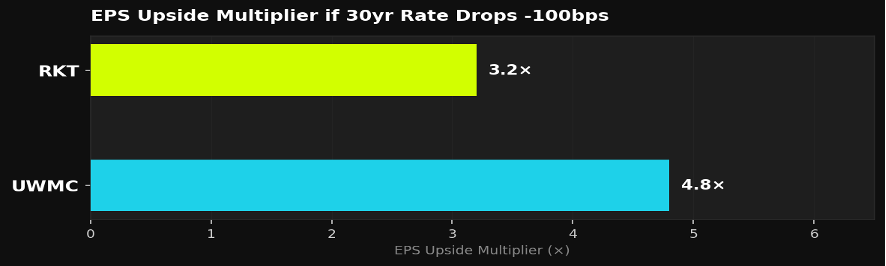
Fig 10 — EPS Upside Multiplier if 30yr Rate Drops -100bps
Key Catalysts
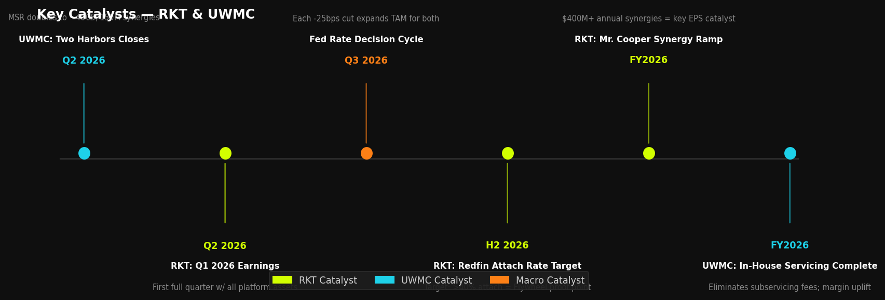
Fig 11 — Key Catalyst Timeline — RKT & UWMC
Scenario Valuation
RKT
Scenario | Price Target | Upside | Key Assumption | Probability |
|---|---|---|---|---|
Bull | $30.00 | +106% | Rate normalization + full synergy realization + fintech re-rate | 30% |
Base | $22.00 | +51% | Continued synergy delivery, modestly improving rates, analyst upgrades | 45% |
Bear | $13.00 | -11% | Higher-for-longer rates, integration stumbles, multiple compression | 25% |
UWMC
Scenario | Price Target | Upside | Key Assumption | Probability |
|---|---|---|---|---|
Bull | $10.50 | +117% | Fed cuts aggressively; refinance wave; TWO synergies exceed $150M | 20% |
Base | $6.00 | +24% | Modest rate decline, TWO integration on track, market share maintained | 45% |
Bear | $3.50 | -28% | Higher-for-longer rates; "All-In" legal loss; margin compression | 35% |
Verdicts
RKT — BUY | PT $22.00 | +51% Upside
Rocket Companies has earned the right to be valued as more than a mortgage originator. The Q4 2025 inflection — 3.20% GOS margin, 105.6% revenue growth, GAAP profitability, and $47.3B in record originations — confirms the Flywheel is not just a narrative. It is working. The stock's sharp decline from $24.36 to sub-$15 reflects rate anxiety and technical breakdown, not fundamental deterioration. At 5.8x TTM P/S (compressing rapidly as revenue grows) and with Norway's sovereign wealth fund accumulating 9.38M shares at current levels, the setup is attractive. The bear case is real — integration is complex, rates are sticky, and the stock is technically broken — but the catalyst set is powerful and the margin of safety is growing. We initiate at BUY with a $22.00 PT.
UWMC — HOLD | PT $6.00 | +24% Upside
UWM Holdings is an operationally excellent business executing its strategy with precision. Record origination volumes, expanding GOS margins, and a transformative servicing acquisition demonstrate management's ability to deliver. But the investment case hinges almost entirely on a single macro variable: interest rate normalization. Trading at 54.83x Price-to-Book — a steep premium to RKT's 1.80x — the stock prices in a degree of cyclical optimism that is not yet supported by the data. The persistent insider selling, "All-In" legal overhang, and binary macro dependency create a risk/reward that does not justify a full BUY. We rate UWMC HOLD at $6.00, watching for TWO integration confirmation and a rate cut catalyst to re-evaluate.
FAQ
Why is RKT's GOS margin so much higher than UWMC's?
Direct-to-consumer retail mortgage lending structurally commands a pricing premium because borrowers who come directly to Rocket have lower rate-shopping intensity than borrowers using broker networks. RKT's 3.20% vs. UWMC's 1.30% is not an efficiency gap — it is a channel structure difference. UWMC's wholesale model competes on price by design, enabling brokers to offer competitive rates. RKT's brand, NPS of 70+, and seamless digital experience support premium pricing that UWMC's B2B model cannot replicate.
If UWMC has higher rate cut sensitivity, why isn't it the better bet?
Higher rate cut sensitivity is a double-edged sword. It means UWMC is also more vulnerable to a "higher for longer" scenario. RKT's diversified revenue — $5B in recurring servicing fees, growing "Other Income" from Redfin, Rocket Money, and Amrock — provides meaningful insulation. Additionally, rate cuts benefit RKT through two channels: lower rates driving purchase/refi volume AND unlocking refinancing recapture from its 9.5M serviced clients. UWMC gets only the first channel, without the captive recapture engine.
What is the biggest risk to the RKT bull case?
Integration execution. Absorbing Redfin ($1.75B) and Mr. Cooper ($14.2B) simultaneously is operationally complex. Any sign that the Redfin mortgage attach rate is not growing toward the 40%+ target, or that Mr. Cooper synergies are falling short of the $400M guided target, would collapse the fintech premium multiple. The FHFA's 20% GSE servicing market share cap also limits future M&A as a growth lever.
Risk Factors
● Interest Rate Risk: Both companies face suppressed origination volume if the Federal Reserve maintains elevated rates through 2026. RKT is partially hedged through servicing income; UWMC is not.
● Execution Risk (RKT): Post-merger integration of Redfin and Mr. Cooper involves cultural, systems, and operational complexity that could delay synergy realization.
● Legal Risk (UWMC): The "All-In" policy faces ongoing antitrust class-action litigation. A material adverse ruling could structurally impair UWMC's broker network lock-in strategy.
● Leverage Risk (UWMC): Non-funding D/E of 2.45x and reliance on capital markets creates vulnerability in a credit tightening environment.
● Valuation Risk: Both stocks are high-beta. Any deterioration in housing market sentiment or macroeconomic shocks could amplify downside moves.
● Insider Selling (UWMC): CEO Mat Ishbia has sold hundreds of millions in UWMC stock via a pre-arranged 10b5-1 plan, creating a persistent technical headwind.
Edgen Research · For informational purposes only. Not investment advice. · March 17, 2026
Recommend